VeDAS Vehicle Data Analysing System
TROUT developed and started to distribute a Vehicle Data Analyzing System, VeDAS for short. Launch customer is Rheinmetall Landsysteme GmbH.
In the context of the use of vehicles for demanding tasks, problems arose, among other things, with regard to the load beyond specified limits, as well as difficulties in recognizing and correcting systematic errors and in introducing needs-based maintenance.
The foregoing resulted in requirements for the development of an autarkic system which can be easily adapted to different vehicles and which, thanks to a consequent structured structure in hardware and software, meets special requirements and which can be used cost-effectively and reliably.
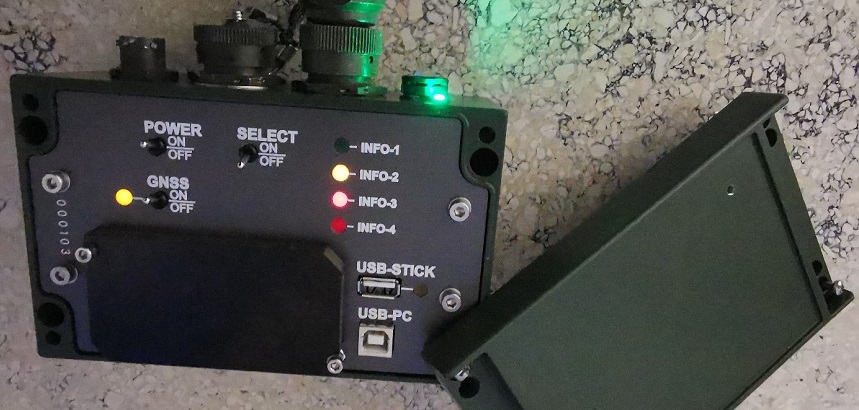
It is used for the automatic acquisition of vehicle data and their evaluation. Communication with the associated evaluation system takes place quickly and securely (safety & security) using a mobile storage medium or wireless communication.
The detected data includes the accelerations and vibrations experienced by the vehicle as well as its location. In addition, speed and distance covered are recorded. In order to take possible environmental influences into account, temperature and humidity are determined. In addition, a structure-borne sound microphone provides information about the operating status of the monitored vehicle. In addition, data provided by an engine control unit, for example, can be taken into account via a CAN bus interface.
In addition to vehicle data acquisition, VeDAS has a logbook function for documenting maintenance activities. Maintenance intervals and deadlines are noted here for the vehicle assemblies entered.
Structure of the evaluation software
Via the drop-down menu “Vehicle”, the user selects the desired vehicle for which data has been recorded in advance. The following tabs then contain the vehicle data and the possibility of evaluating them.
- Vehicle data: Creation and modification of vehicle master data, summary of all vehicle data, graphical representation of terrain / road section
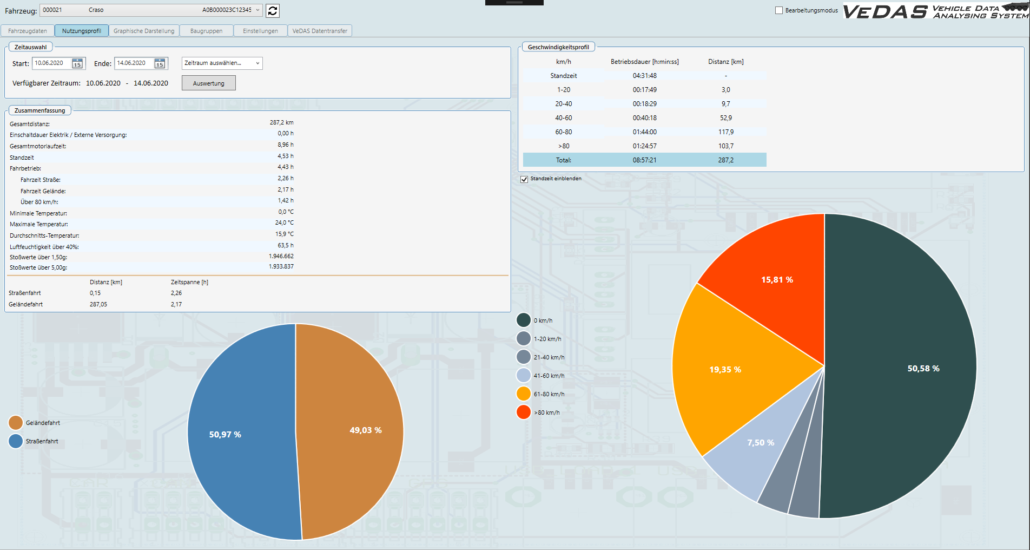
- Usage profile: Evaluation of the vehicle data after a selectable period.
- Graphical representation: route of the vehicle, graphical representation of the vehicle data, structure-borne noise, impact diagram
- Assemblies: Organization of the condition-monitored components
- Settings: language setting, directories, export settings, definition of limit values and correction factors.
- VeDAS data transfer: configuration of the VeDAS data stick, data import from the data stick.
- Vehicle-specific identification numbers and identifiers as well as the date for the last maintenance, the next maintenance and the last data import can be found under master data.
Graphical representation
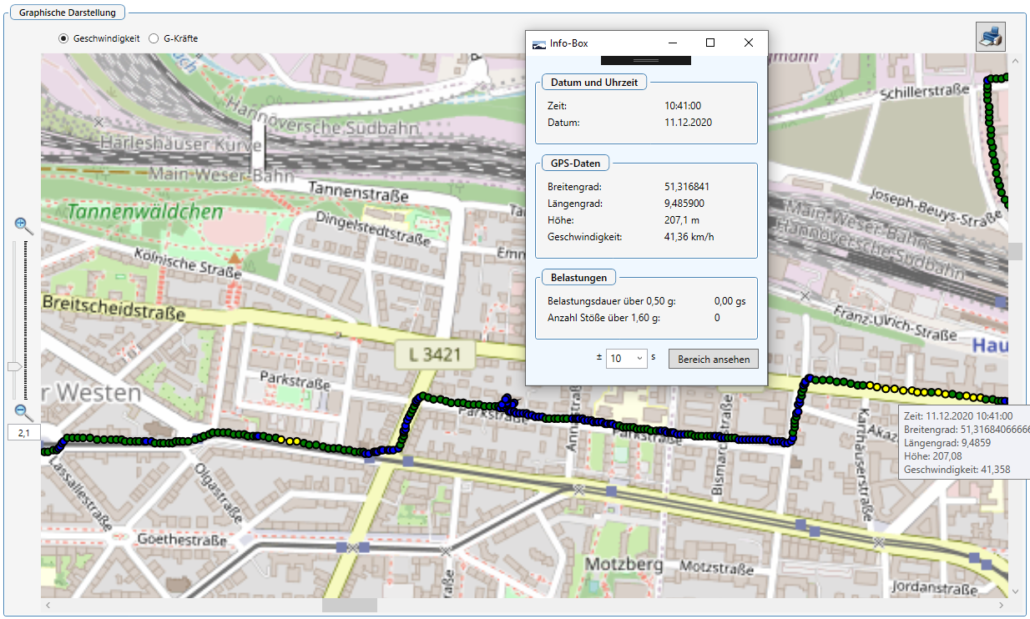
In the configuration area, the map material and the route are called up for the “graphic display”.
If a corresponding map is loaded, the GPS data available in the route are transferred to this map. The user can track the course of the vehicle.
The color of the markings on the card indicates the speed or other parameters, depending on the operator selection.
Each marking on the map can be selected by the user in order to receive additional information such as temperature and humidity. In addition, the user can select a time frame around this point in order to switch to the “Graphical evaluation” tab and analyze the area around this point.
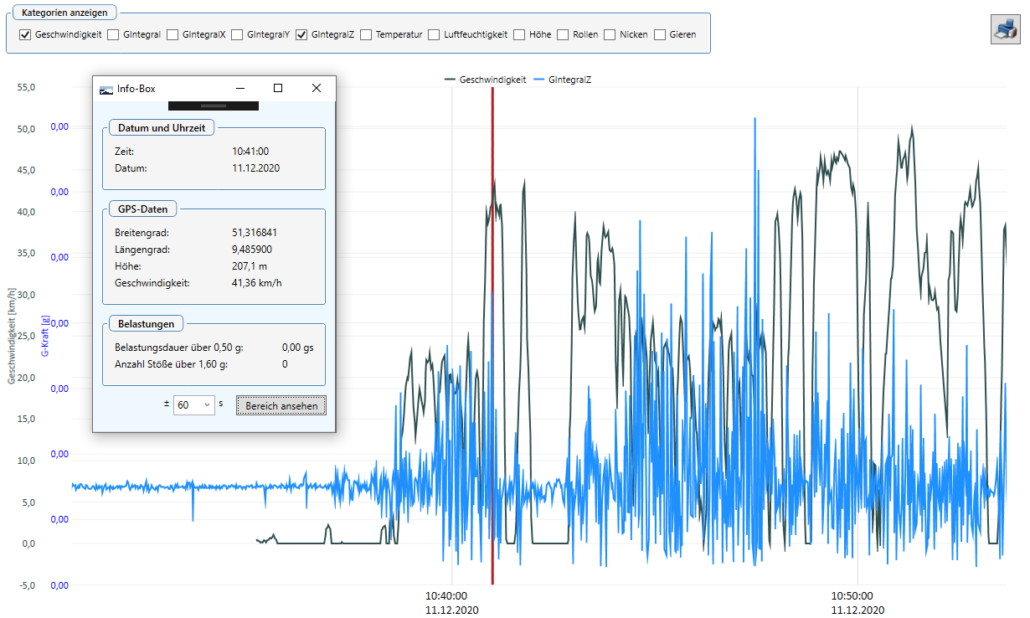
“Kategorien anzeigen” enables the user to select and display measurement data in a diagram.
Machine learning
Vehicle data from the CAN bus and sensors connected with the VeDAS Box are written to a ring memory after filtering with data reduction and a plausibility check. The capacity of the ring memory includes measurement data of several months. The data can be exported from the ring memory to a database on a PC/laptop at any desired time. There, the data can be evaluated and visualized via a pre-installed artificial intelligence module.
The procedure for calculating potentially required maintenance work on vehicle components is analogous. An evaluation of the measured structure-borne noise spectrum is also included here. The frequency range from 6 Hz to 20 kHz is considered. Measuring the entire frequency range in one measurement would generate a very large amount of data, since a long period of time is required to measure low frequencies. It therefore makes sense to carry out several measurements for different frequency ranges, in which the amount of data can still be evaluated.
In the initial configuration, the sensor has a starter set of frequencies with time intervals for which measurements are carried out. (Duration of measurement TM1, TM2, TM3 and measurement frequency MF1, MF2, MF3).
Reference Customer